 I’m incredibly pleased to write that O’Reilly Japan has just completed a Japanese translation of Visualizing Data. The book is available for pre-order on Amazon, and has also been announced on O’Reilly’s Japanese site.
Having the book published in Japanese is incredibly gratifying. Two of my greatest mentors (Suguru Ishizaki at CMU, and later John Maeda at MIT) were Japanese Americans who trained at Tsukuba University, training that informed both their own work and their teaching style.
I first unveiled Processing during a two week workshop course at Musashino Art University in Japan in August 2001, working with a group of about 40 students. And in 2005, we won the Interactive Design Prize from the Tokyo Type Director’s Club.
At any rate, I can’t wait to see the book in person, this is just too cool.
Received a note from Vitor Silva, who created the Portuguese-language examples from Visualizing Data using Processing.js:
i created a more “world friendly” version of the initial post. it’s now in english (hopefully in a better translation than babelfish) and it includes a variation on your examples of chapter 3.
The new page can be found here. And will you be shocked to hear that indeed it is far better than Babelfish?
Many thanks to Vitor for the examples and the update.
Very cool! Check out these implementations of several Visualizing Data examples that make use of John Resig’s Processing.js, an adaptation of the Processing API with pure JavaScript. This means running in a web browser with no additional plug-ins (no Java Virtual Machine kicking in while you take a sip of coffee—much less drain the whole cup, depending the speed of your computer). Since the first couple chapters cover straightforward, static exercises, I’d been wanting to try this, but it’s more fun when someone beats you to it. (Nothing is better than feeling like a slacker, after all.)
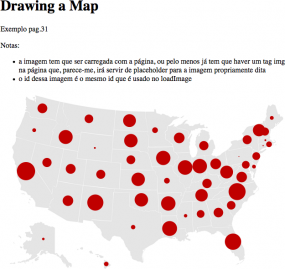 View the introductory Processing sketch from Page 22, or the map of the United States populated with random data points from Page 35.
Babelfish translation of the page here, with choice quotes like “also the shipment of external filing-cabinets had that to be different of what was in the book.”
And the thing is, when I finished the proof of the book for O’Reilly, I had this uneasy feeling that I was shipping the wrong filing-cabinets. Particularly the external ones.

 I’m incredibly pleased to write that O’Reilly Japan has just completed a Japanese translation of Visualizing Data. The book is available for pre-order on Amazon, and has also been announced on O’Reilly’s Japanese site.